

- MUA Home
- All Project Journals
- ECU Project Introduction
-
- 9/6/06 Day 1
- 9/7/06 Day 2
- 9/8/06 Day 3
- 9/11/06 Day 4
- 9/12/06 Day 5
- 9/13/06 Day 6
- 9/14/06 Day 7
- 9/15/06 Day 8
- 9/18/06 Day 9
- 9/19/06 Day 10
- 9/20/06 Day 11
- 9/21/06 Day 12
- 9/22/06 Day 13
- 9/25/06 Day 14
- 9/26/06 Day 15
- 9/27/06 Day 16
- 9/28/06 Day 17
- 9/29/06 Day 18
-
- Week 1
- Week 2
- Week 3
- Week 4 With Video
- Week 5
- Week 6
- Week 7
- Week 8
- Jan 07 Entry
- Final Entry
- Field School
Crew Page - Project
Retrospective Video - ECU Maritime
Home Page - ECU Maritime
Student Page - ECU 2007 Summer
Field School - _______________
- MUA Learning
Assessment
ECU's 2006 Fall Field School
Project Journal
12 September 2006
By Michelle Damian

Somehow when imagining working as an underwater archaeologist, I had never stopped to consider days when I would still be “in the field”… yet never get on a boat, never don mask and snorkel, never get wet. When reading site reports of other projects, invariably I would come across a map of the nearest land feature, often with an inset detail showing the shoreline nearest to the project site. I had usually glanced at those, noting their presence in the back of my mind but never really thinking about how they got there. That changed this week. Part of the process of recording “Site A” includes thoroughly mapping both the Washington waterfront and the shoreline opposite, and placing the vessels and structures we’ve located in the water within that map.
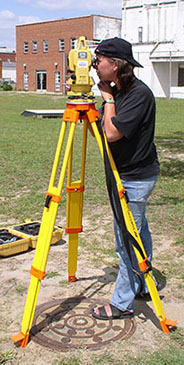
Michelle and the total station.
When looking at historical maps, I’d often wondered how surveyors hundreds of years ago were able to map shorelines so accurately without the benefit of aerial photographs. I’m still not entirely sure how they did it, but we at least are fortunate enough to have a little more advanced technology, namely, the compact and efficient “total station.” This machine helps us record exactly where each feature is, allowing us to create a map of the entire area.
The process begins by selecting a datum point. This should be something that can be relocated years from now so that should someone need to return to our site, they could find it by starting from that datum. With that in mind, choosing someone’s parked car as a datum is NOT recommended. We used a manhole cover for two reasons: the same datum point was used in a 1998 ECU project and therefore enables us to juxtapose our map with earlier data, and as the town of Washington is unlikely to change their sewer system anytime soon, we feel fairly confident that our datum point will remain.
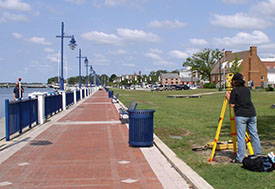
Joe and Michelle use the total station to map the shoreline.
We set up the total station over the datum and oriented it. Telling the machine which direction to consider “north” allows it to calculate which direction the lens is facing as it is turned. The other important piece of equipment is the stadia rod and prism, which another member of the team holds on the target to be “shot” (recorded). Inputting the height of both the total station and the prism into the total station’s computer enables it to calculate the actual distance from the datum point to the target being shot. A simple touch of the “measure” button displays the angles and distances between the total station and the prism. I have a new respect for those long-ago surveyors who did not have the numbers presented to them on a neat LED readout.
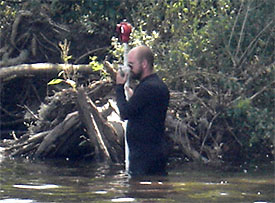
Joe holds the prism on site.
Over two days we were able to record points all along the waterfront, the opposite shoreline, and the buoys we had previously left on the wreck sites. Joe Hoyt braved mammoth spiders, dilapidated piers, and sinkholes as he brought the prism from point to point along the shoreline, while I had the easy job: pressing that “measure” button again and again!
The results of the shoreline survey so far are a rough sketch of where we shot each point and a list of a hundred angles and distances. Translating all of the numeric data into a scale map will be a time-consuming process but will culminate in one of those detailed inset maps. I’m sure when I see similar maps in other reports in the future I’ll give them more than just a passing glance. In doing all this, we have related the shipwrecks in the cove to features on land, and have kept this underwater archaeologist dry and on shore for the day.
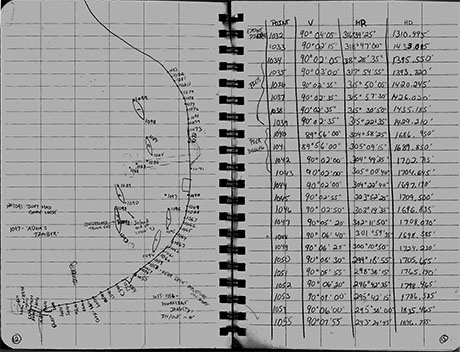
Data recorded by Joe and Michelle with the total station.
For more information you can visit the ECU website at:
http://www.ecu.edu/maritime/index.htm
Return to Project Journal home page.