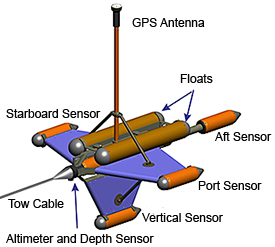
Marine Magnetics Gradiometer.
Technology & Methodology
Magnetometers measure the earth’s total magnetic field and are commonly used in maritime archeological research to detect ferro-metallic objects. Such objects create small magnetic fields that appear as localized deviations in the earth’s magnetic field. Gradiometers are a specialized type of magnetometer that measures the gradient, or the rate of change, of the earth’s magnetic field. Gradiometers are comprised of multiple magnetometers that are separated by fixed distances. As the gradiometer’s magnetometers simultaneously measure the earth’s magnetic field the differences in intensity that they record are divided by the distances between each sensor to provide a linear estimate of the gradient. The orientation of the sensors determine which axis of the magnetic field is measured, X, Y, or Z.
The advantages of gradiometers over magnetometers include their ability to reduce or eliminate diurnal variation and their tendency to suppress long wavelength geological anomalies that can mask small targets. Two sensor gradiometers have been used for many years to measure a single axis of the magnetic gradient.
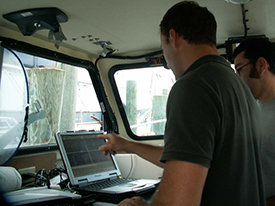
Examining the gradiometer readout aboard the research vessel.
The instrument used during the present study, the Marine Magnetics SeaQuest gradiometer, measures all three axes of the gradient simultaneously. With all three axes of the gradient the total strength of an object’s magnetic influence or its magnetic moment, can be accurately calculated while ignoring its direction. The data produced by this process are known as the total gradient or the analytic signal and are expressed in nanoTeslas per meter (nT/m).
Plotting the analytic signal shows anomalies as positive peaks that are centered directly over their source. This enables the discrimination of small closely-spaced objects and the accurate calculations of their masses and locations.
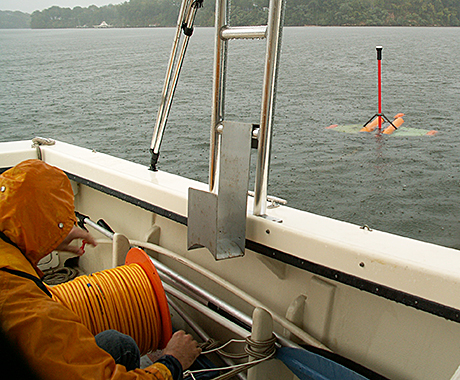
Deployed gradiometer and cable spool on research vessel.
Equipment
The SeaQuest gradiometer includes four sensors: Port, Starboard, Vertical and Aft. An altimeter, a depth sensor, and a GPS antenna are mounted on the sensor platform that enable monitoring of its position in the water column and eliminate the need to calculate layback. The towing depth is adjusted by changing vessel speed. The position of floats mounted on top of the sensor platform keep the gradiometer at the surface when it is not in motion. The tow cable extends from the platform to a spool on deck and data are transmitted to a laptop running Marine Magnetics data acquisition program SeaLINK via Bluetooth. SeaLINK measures and displays the total magnetic field and calculates and displays the horizontal, vertical, longitudinal and total magnetic gradients in real time while displaying the position of the sensor platform in the water column as an aid to help keep it at a consistent height during survey.
We used Hypack software to plan survey transects and control navigation. Transects were spaced at 3.0 m with offline distances not to exceed 2 m. This ensured a maximum lane spacing of approximately 5.0 m.
Such closely spaced transects are necessary to collect data of sufficient density to take full advantage of the SeaQuest system. Transect spacing of 15 m or more would greatly diminish the advantages of using this system over a magnetometer. This makes the SeaQuest gradiometer more suitable for creating high resolution magnetic maps of known sites than for large scale searches for buried shipwrecks.
Nevertheless, we made attempts to deploy the gradiometer in our search for Cato and Hawk, but were thwarted by poor weather, rough seas, and great numbers of crab pots and other obstructions that made following such closely spaced transects difficult. We quickly discovered that staying on course and avoiding snags while towing the sensor platform a distance of more than three times the length of our survey vessel – which was required because of the gradiometer’s sensitivity -- made successfully testing this technology at this location impossible during the time we had available for this study.
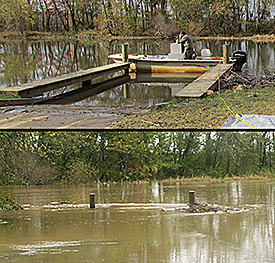
Boat dock at normal (top) and flood levels (bottom).
As a result, we sought a more suitable location and were granted permission by NOAA’s Office of Ocean Exploration and Research to change our survey area to the stretch of the Patuxent River where the Chesapeake Flotilla is believed to have been scuttled during August 1814. We planned our survey to cover a stretch of the river where a ship was discovered during the late 1970s that may have been the flagship of the Chesapeake Flotilla, Scorpion. This area was an excellent choice for the present study because of its size and accessibility. However, we encountered impressive currents and periods of abnormally high and low water as a result of a series of unexpected autumn storms. This required time delays but the survey was subsequently completed successfully.
We collected data using a sampling rate of 2 Hertz which enabled the logging of two readings per second at a vessel speed of between 1 and 2 knots resulting in the collection of at least one reading every 50 cm along transects spaced at a maximum of 5.0 m intervals. All four sensors were deployed during survey of the river channel, but numerous snags and shallow water along its banks prevented the use of the vertical sensor in portions of the survey area. Lack of data from the vertical sensor required additional post-processing, but did not adversely affect our results.
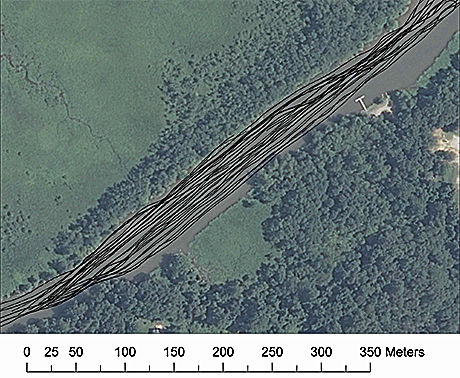
View survey lanes run in the Patuxent River.
Comments, suggestions, and questions can be directed to Dr. Susan Langley
Return to In The Field home page.


