


- Recent Guest Blogs
- Amanda Evans
- Dave Howe
- Kimberly Faulk
- Archive of Past Bloggers
- Anthology PDF
- Maritime Art Gallery
- Educational Resources
- Teaching Kit
- Worldwide Site Map
- Links
- U of Rhode Island
- The MUA is a non profit 501c3 organization. Please consider supporting our mission of public outreach with a donation.
I recently graduated from the University of Miami’s Rosenstiel School of Marine and Atmospheric Science (RSMAS) in 2010 with an M.A. in Marine Affairs and Policy. For my graduate thesis I merged geographical information systems (GIS) with underwater videography to produce rectified images of excavation levels at the prehistoric archaeological site Little Salt Spring (8SO18; LSS for the rest of this post). During my first semester at RSMAS I enrolled in the Marine Affairs Spatial Analysis course. The final exam of the course was to create a spatial analysis project, so Dr. John Gifford, instructor for the Marine Affairs Spatial Analysis course, provided me with 50 images of one of the excavation squares at LSS and told me I should create a photomosaic for the excavation level for a final project.

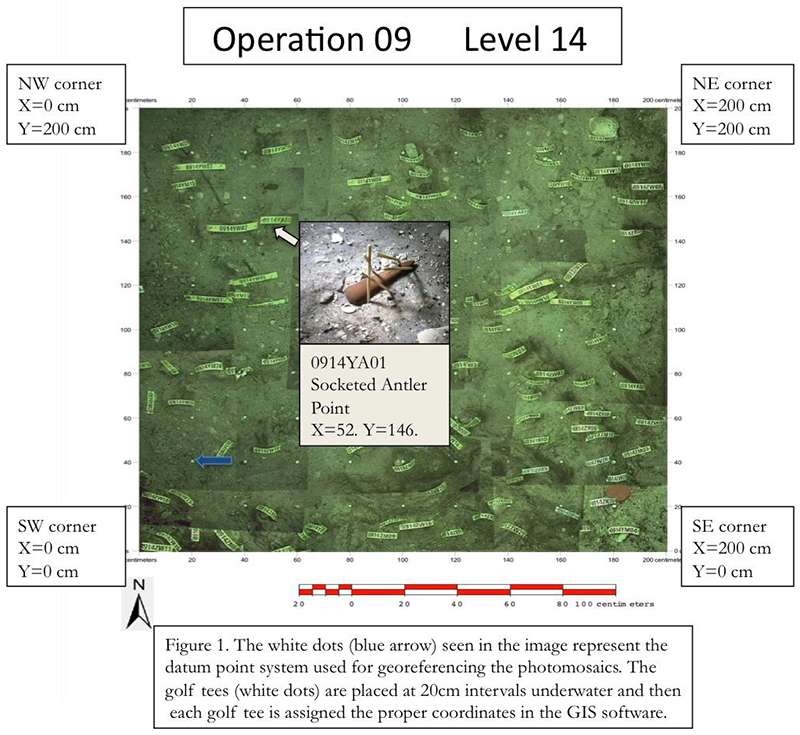
Figure 1. Socketed Antler Point (Large View ).
First, I used a standard photo-stitching program to reconstruct the individual images into a photomosaic. Next, I opened the photomosaic in ArcGIS and attempted to georeference the image by creating a grid over the image. The result was a fairly decent looking photo mosaic, but there was no accurate way to extract the coordinates from the image. This made my first photomosaic attempt unsuccessful because the main reason for making the photomosaic was to record the context of the excavation.
In the Fall semester of 2008, I signed up for the Prehistoric Underwater Archaeological Field School. During the 10-day excavation portion of the field school in January 2009 I decided I wanted to do my graduate internship at LSS. Dr. Gifford suggested I should make the photo mosaic project my thesis. I learned a lot during the field school about the excavation methods used at the site, and I also learned about the coordinate system used for mapping the excavations. I will now explain the coordinate system that is used at LSS as well as the steps needed to create the individual images used for the photomosaics.
After a level has been excavated, a grid system is established by inserting datum points (plastic golf tees) at 20-centimeter intervals into the sediment surface within the 2x2 meter excavation square. The datum points’ locations are the known relative reference points for the entire square. As a convention, the southwest corner of every excavation square represents Cartesian coordinate X=0,Y=0 centimeters and the northeast corner represents X=200,Y=200 centimeters.
Once the grid has been set, a single dive is dedicated to videotaping the square. Videotaping begins at the southwestern origin (X=0,Y=0 centimeters); the diver then slowly moves the camera north along the westernmost North-South line to the northwestern point (X=0,Y=200 centimeters). The diver then moves the camera east 40 centimeters and slowly moves south with the camera. The excavation surface is recorded by this method until the entire square has been videotaped.
Video footage of each excavation level is digitized using a commercial software package (Adobe Premiere). Once digitized it may be played back and paused when the desired image is displayed; then, by clicking on the screen and using the copy function the user may capture individual video frames as still digital images. About 50 images are captured from the video for each excavation level.
I quickly learned that using a standard photo-stitching program is not the best way to combine the images because it combines them based on identical sub-sections coming to adjacent images. It is much more accurate to stitch the images based on the common X,Y coordinates of a square's relative grid system (0,0 to 200,200 cm) that are displayed in each image. Item ID 0914YA01 seen in (figure 1) is a socketed antler point. LSS contains a lot of bone and shell tools because siliceous stone like chert and flint was in short supply.
Now the standard operating procedure for creating the photomosaics is to georeference each datum point (a white plastic golf tee) visible in an image with its relative X,Y coordinates using a GIS software package called TNTmips Professional (product of Microimages, Inc.). These images are then combined using the mosaic function of TNTmips. The mosaic function joins the images based on the common coordinate points found in adjacent images. This produces a much more accurate photomosaic. The user can "mouse over" a georeferenced mosaic of one excavation level in TNT Mips and immediately view any object's X,Y coordinates relative to the square's X=0,Y=0 SW corner origin. These coordinates represent the provenience of archaeological material after it has been recovered; they are entered into the master database for that excavation square. Using this method I was able to create photomosaics for several different excavation levels in the LSS basin (about 25 feet deep).

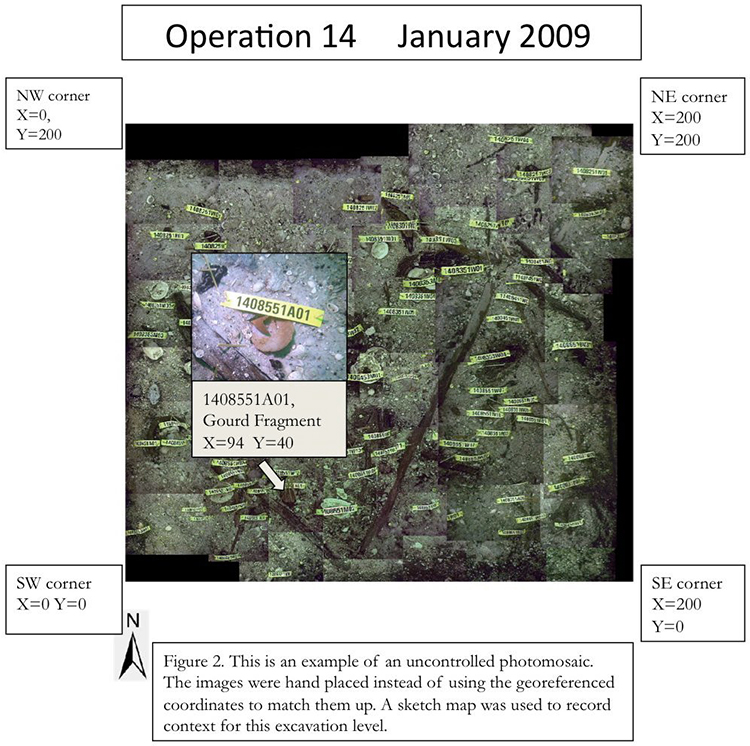
Figure 2. Gourd Fragment (Large View ).
During the 2009 field school (before I started my internship) a new method of mapping was being tested so the usual golf tee grid system was not set up while we filmed the excavation. This new method did not work as well as the 20cm interval grid method so a few months later we attempted to set the grid and film. However, the original video footage was used because the quality was much better and the gourd fragment 1408851A01 seen in figure 2 was removed after the first video was filmed. A photomosaic of the level was made by hand placing the images in TNTmips instead of using the mosaic feature. This photomosaic serves as a visual reference but does not provide context for any of the archaeological material. A sketched map, which is taken as a back up for each 10-cm excavation level, served as the context for this level (figure 2).
After I created a few photomosaics for levels that had been dug in some of the older excavation seasons it became apparent that we needed to add a third dimension for the current excavations. Before the 2009 field season only the X and Y coordinates of a given level needed to be recorded because the levels were completely horizontal - excavation was in a homogeneous quartz sand with no visible stratification. However, levels that were excavated beginning in the 2010 field season were located on about a 23-degree slope, so a Z value is recorded for each datum point that was placed. This required a little more advanced GIS mapping technique.

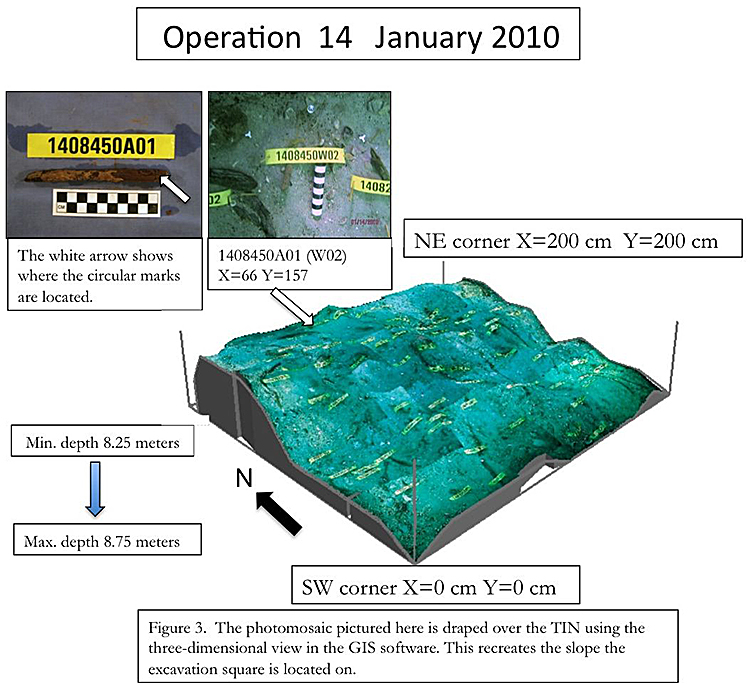
Figure 3. Three dimensional view in GIS software (Large View ).
A Triangulated Irregular Network (TIN) is created using the Z depth values of the datum points. TNTmips uses elevation rather then depth, so the lowest depth value is set to 0 centimeters (relative elevation) and the difference between the lowest and highest depth (at the south and north edge of the 2x2 meter square) is set as the greatest elevation value. Once the TIN is created, surface modeling (specifically using a mathematical technique called Kriging) is applied to conform the TIN to the mosaic. The last step is to display the surface model and the mosaic in a three-dimensional view. The program then drapes the mosaic over the TIN surface model, recreating the slope and allowing the user to manipulate the three-dimensional image. In figure 3 Item ID 1408450W02 was changed to A01. Once the wood was brought to the surface some small circular marks were noticed on one of the ends. This is why every object is labeled and recorded; sometimes we don't know if something is an artifact until we retrieve it.
The three-dimensional mosaic is good for visualizing the slope but I could not find a way to extract the coordinates. When the depth values were input while georeferencing, the coordinates of items were exactly the same as if the square were completely flat. This was the wall I hit toward the end of my project. This will be important to overcome because it is necessary to know how much of an effect the slope has on the coordinates of the archaeological material if this is going to be the primary method to record context at LSS.
The videography and GIS implemented at LSS has been very successful considering the low budget the project has been operating on for nearly two decades. I was able to create two-dimensional mosaics but there was no usable data for a three-dimensional mosaic until the January 2010 excavation. One of the limitations in using this method to record the context occurs when capturing the video footage. The slope can affect the quality of the video and the accuracy of the photo mosaic. However, if special attention is given to ensure good quality footage, this problem can be overcome. With the right funding, ingenuity, and equipment it is possible to develop a method that will work perfectly each time.
As of January 2011 a Masters of Professional Science (MPS) degree in the management of the underwater cultural heritage (MUCH) is being offered by RSMAS.
http://mps.rsmas.miami.edu/degree-program/underwater-archaeology/
The LSS field school in prehistoric underwater archaeology is still offered every Fall semester and if you're interested you can pick up where I left off in the processing of video imagery and make it even more accurate. For more information about Little Salt Spring please visit:
http://www.rsmas.miami.edu/groups/little-salt-spring/.
Return to In The Field home page.
Comments, suggestions, or questions can be directed to research@themua.org